syncfusion_flutter_charts_ohos 1.0.0  syncfusion_flutter_charts_ohos: ^1.0.0 copied to clipboard
Retrieve Ohos device user agents in Flutter.
Flutter Charts library #
The Flutter Charts package is a data visualization library written natively in Dart for creating beautiful, animated and high-performance charts, which are used to craft high-quality mobile app user interfaces using Flutter.
Overview #
Create various types of cartesian, circular and spark charts with seamless interaction, responsiveness, and smooth animation. It has a rich set of features, and it is completely customizable and extendable.
This syncfusion_flutter_charts package includes the following widgets
- SfCartesianChart
- SfCircularChart
- SfPyramidChart
- SfFunnelChart
- SfSparkLineChart
- SfSparkAreaChart
- SfSparkBarChart
- SfSparkWinLossChart
Disclaimer: This is a commercial package. To use this package, you need to have either Syncfusion Commercial License or Free Syncfusion Community license. For more details, please check the LICENSE file.
Table of contents #
- Chart features
- Spark Charts features
- Get the demo application
- Useful links
- Installation
- Chart getting started
- Spark Charts getting started
- Support and Feedback
- About Syncfusion
Chart features #
-
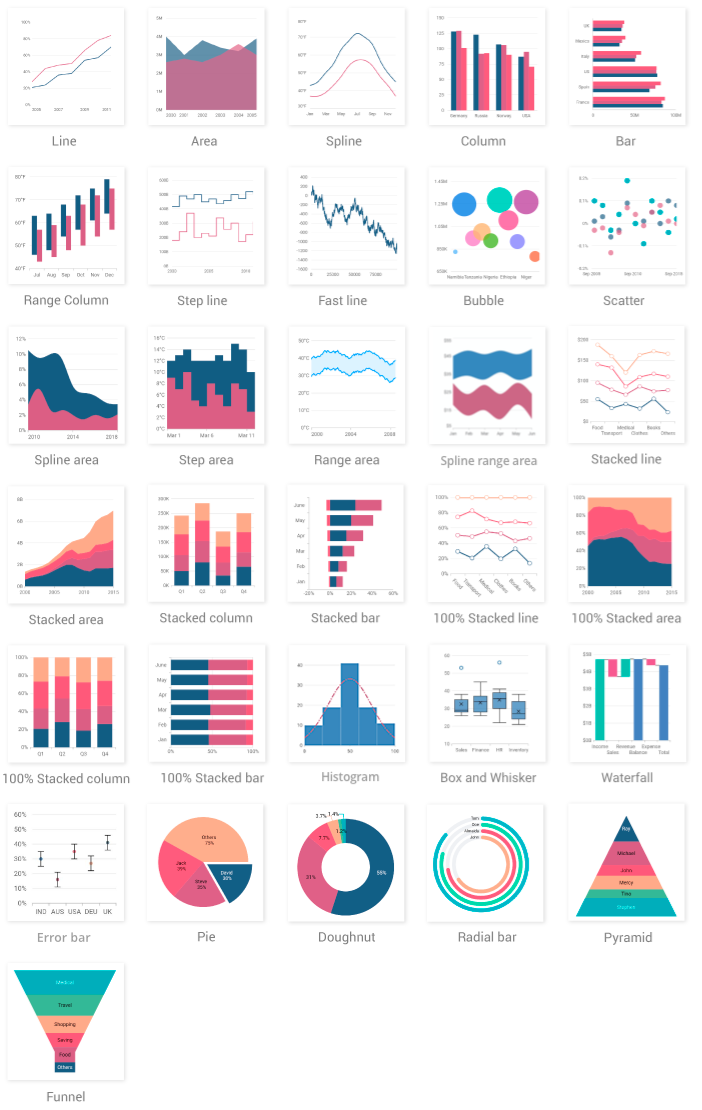
Chart types - Provides functionality for rendering 30+ chart types, namely line, spline, column, bar, area, bubble, box and whisker, scatter, step line, fast line, range column, range area, candle, hilo, ohlc, histogram, step area, spline area, spline range area, stacked area, stacked bar, stacked column, stacked line, 100% stacked area, 100% stacked bar, 100% stacked column, 100% stacked line, waterfall, pie, doughnut, radial bar, pyramid, funnel. Each chart type is easily configured and customized with built-in features for creating stunning visual effects.
-
Axis types - Plot various types of data in a graph with the help of numeric, category, date-time, date-time category and log axis types. The built-in axis features allow to customize an axis elements further to make the axis more readable.

-
User interaction - The end-user experience is greatly enhanced by including the user interaction features such as zooming and panning, crosshair, trackball, callbacks, selection, tooltip, and auto-scrolling in chart.

-
Legends - Display additional information about the chart series. The chart legend can also be used to collapse the series. The legends can be wrapped or scrolled if an item exceeds the available bounds.
-
Dynamic update - Updates the chart dynamically or lazily with live data that changes over seconds or minutes like stock prices, temperature, speed, etc.
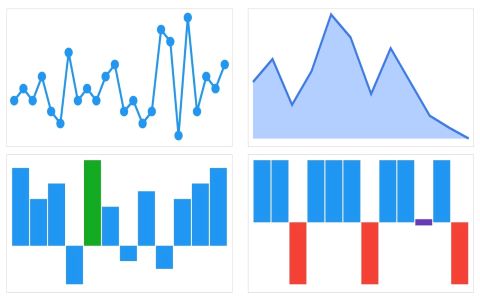
Spark Charts features #
Spark charts (Sparkline charts) which is also known as micro charts are lightweight charts that fit in a very small area. They display the trend of the data and convey quick information to the user.
-
Chart types - Support to render line, area, bar and win-loss chart types.
-
Axis types - Spark charts provides support for numeric, category and date-time axes.
-
Markers and data labels - Support to render markers and data labels on high, low, first, last and all data points.
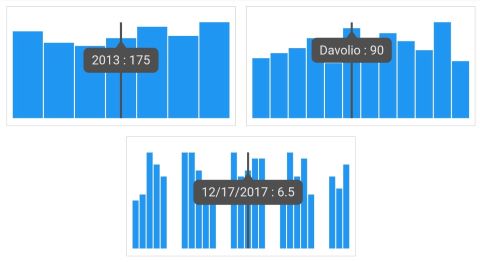
-
Trackball - Display additional information about data points on interaction with the chart.
-
Plot band - Highlight a particular vertical range using a specific color.
-
Live update - Sparkline charts can be used in the live update.
Get the demo application #
Explore the full capabilities of our Flutter widgets on your device by installing our sample browser applications from the below app stores, and view samples code in GitHub.


Other useful links #
Take a look at the following to learn more about Syncfusion Flutter charts:
- Syncfusion Flutter Charts product page
- Video tutorials
- Knowledge base
- Download Free Trial
- Pricing
- User guide documentation
- Online Examples
Installation #
Install the latest version from pub.
Usage #
  yaml
    dependencies:
      syncfusion_flutter_charts: 26.2.10
      syncfusion_flutter_charts_ohos: 1.0.0
Chart getting started #
Import the following package.
import 'package:syncfusion_flutter_charts/charts.dart';
Add chart to the widget tree #
Add the chart widget as a child of any widget. Here, the chart widget is added as a child of container widget.
@override
Widget build(BuildContext context) {
  return Scaffold(
    body: Center(
        child: Container(
          child: SfCartesianChart()
        )
      )
  );
}
Note
- Use
SfCartesianChartwidget to render line, spline, area, column, bar, bubble, scatter, step line, and fast line charts. - Use
SfCircularChartwidget to render pie, doughnut, and radial bar charts. - Use
SfPyramidChartandSfFunnelChartto render pyramid and funnel charts respectively.
Bind data source #
Based on data, initialize the appropriate axis type and series type. In the series, map the data source and the fields for x and y data points. To render a line chart with category axis, initialize appropriate properties.
@override
Widget build(BuildContext context) {
  return Scaffold(
    body: Center(
        child: Container(
          child: SfCartesianChart(
            // Initialize category axis
            primaryXAxis: CategoryAxis(),

            series: <LineSeries<SalesData, String>>[
              LineSeries<SalesData, String>(
                // Bind data source
                dataSource:  <SalesData>[
                  SalesData('Jan', 35),
                  SalesData('Feb', 28),
                  SalesData('Mar', 34),
                  SalesData('Apr', 32),
                  SalesData('May', 40)
                ],
                xValueMapper: (SalesData sales, _) => sales.year,
                yValueMapper: (SalesData sales, _) => sales.sales
              )
            ]
          )
        )
      )
  );
}

class SalesData {
  SalesData(this.year, this.sales);
  final String year;
  final double sales;
}
Add chart elements #
Add the chart elements such as title, legend, data label, and tooltip to display additional information about the data plotted in the chart.
TooltipBehavior _tooltipBehavior;

@override
void initState(){
  _tooltipBehavior = TooltipBehavior(enable: true);
  super.initState();
}

@override
Widget build(BuildContext context) {
  return Scaffold(
    body: Center(
        child: Container(
          child: SfCartesianChart(

            primaryXAxis: CategoryAxis(),
            // Chart title
            title: ChartTitle(text: 'Half yearly sales analysis'),
            // Enable legend
            legend: Legend(isVisible: true),
            // Enable tooltip
            tooltipBehavior: _tooltipBehavior,

            series: <LineSeries<SalesData, String>>[
              LineSeries<SalesData, String>(
                dataSource:  <SalesData>[
                  SalesData('Jan', 35),
                  SalesData('Feb', 28),
                  SalesData('Mar', 34),
                  SalesData('Apr', 32),
                  SalesData('May', 40)
                ],
                xValueMapper: (SalesData sales, _) => sales.year,
                yValueMapper: (SalesData sales, _) => sales.sales,
                // Enable data label
                dataLabelSettings: DataLabelSettings(isVisible: true)
              )
            ]
          )
        )
      )
  );
}
The following screenshot illustrates the result of the above code sample.
Spark Charts getting started #
Import the following package.
import 'package:syncfusion_flutter_charts/sparkcharts.dart';
Add spark charts to the widget tree #
Add the spark charts widget as a child of any widget. Here, the spark charts widget is added as a child of container widget.
@override
Widget build(BuildContext context) {
  return Scaffold(
    body: Center(
        child: Container(
          child: SfSparkLineChart()
        )
      )
  );
}
Note
Use SfSparkAreaChart, SfSparkBarChart and SfSparkWinLossChart widgets to render area, bar and win-loss charts respectively.
Bind spark charts data source #
Based on data and your requirement, initialize the series and bind the data to sparkline charts.
@override
Widget build(BuildContext context) {
  return Scaffold(
    body: Center(
        child: Container(
          child: SfSparkLineChart(
              data: <double>[
                1, 5, -6, 0, 1, -2, 7, -7, -4, -10, 13, -6, 7, 5, 11, 5, 3
              ],
            )
        )
      )
  );
}
Note: Needs to add the data source to render a spark chart.
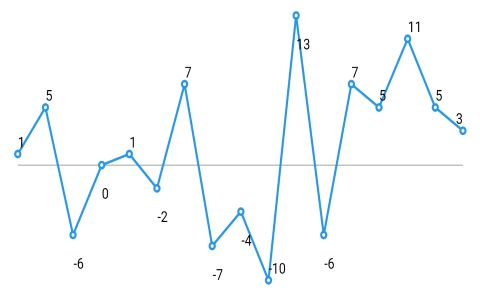
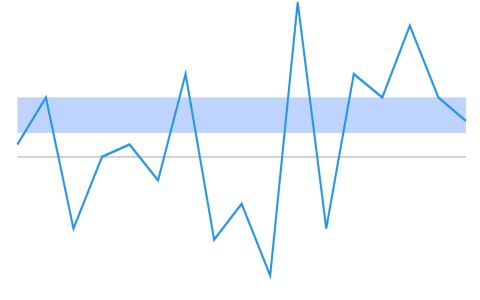
Add spark charts elements #
Add the spark charts elements such as marker, data label, and trackball to display additional information about the data plotted in the spark charts.
@override
Widget build(BuildContext context) {
  return Scaffold(
    body: Center(
        child: Container(
          child: SfSparkLineChart(
              //Enable the trackball
              trackball: SparkChartTrackball(
                  activationMode: SparkChartActivationMode.tap),
              //Enable marker
              marker: SparkChartMarker(
                  displayMode: SparkChartMarkerDisplayMode.all),
              //Enable data label
              labelDisplayMode: SparkChartLabelDisplayMode.all,
              data: <double>[
                1, 5, -6, 0, 1, -2, 7, -7, -4, -10, 13, -6, 7, 5, 11, 5, 3
              ],
            )
        )
      )
  );
}
Support and Feedback #
- For any other queries, reach our Syncfusion support team or post the queries through the Community forums and submit a feature request or a bug through our Feedback portal.
- To renew the subscription, click renew or contact our sales team at salessupport@syncfusion.com | Toll Free: 1-888-9 DOTNET.
Metadata

Publisher
unverified uploader
Weekly Downloads
Metadata
Retrieve Ohos device user agents in Flutter.
Documentation
License
![]() unknown (license)
unknown (license)
Dependencies
flutter, intl, syncfusion_flutter_core, vector_math